Measured sound pressures and associated diagrams are exciting and informative for all those who like to deal with sound, but often incomprehensible for laypeople. For the vast majority, a visual representation of sound emanating from the source is fascinating. The following visualization shows the acoustic effects of selected tiles in relation to their roughness. A difference of 20-25 dB, which results from the different roughness of the tiles, corresponds to a quadrupling of perceived noise.
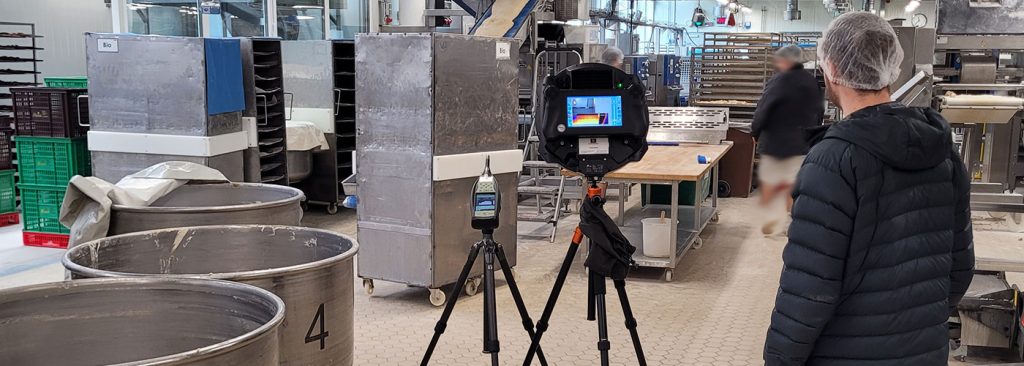
We are pleased to always find new uses for our SoundCam 2.0 and thus to be able to offer an excellent tool for pointing out various problems.